Closed-Loop Performance Media.
Optimizing algorithms for clinical capacity, commercial payer mix, and high-acuity revenue—not raw clicks.

The Loop That Closes on Revenue.
Execute a precision-targeted paid media strategy that achieves three distinct outcomes: predictable net-new patient growth, increased patient retention, and an expanded share of wallet—all while aggressively controlling Cost-Per-Acquisition (CPA) and shifting the payer mix toward commercial and cash-pay.

Two Models. Structurally Different Incentives.
The industry-standard agency model charges 12–20% of media spend—a compounding cost structure that ties agency revenue directly to spending volume rather than performance outcomes. Our infrastructure model is built on a different economic architecture entirely.
- ✗ 12–20% of total media spend charged as management fee—compounding as you scale locations
- ✗ Agency is incentivized to inflate budget, not improve unit economics
- ✗ Zero EMR visibility—optimizes for raw lead volume, not clinical revenue
- ✗ Floods front desk with low-intent, low-margin generic consults
- ✓ Flat-fee, declining-rate model—cost per location drops as you scale
- ✓ We are incentivized to optimize efficiency, not inflate your spend
- ✓ Full EMR integration—algorithms optimize for actual clinical revenue and payer mix
- ✓ Capacity-aware throttling protects operational EBITDA at every location
Calculate Your Agency Scale Tax.
When an agency charges a percentage of your media spend, they are inherently incentivized to spend more of your capital blindly, not spend it smarter.
Use this tool to calculate the exact enterprise value you are losing to your agency's fee structure, and see the financial lift created by switching to the Strategy Collective flat-fee CapEx model.
Market context at your monthly spend: 14%
Minimum spend enforced at $12K/loc/yr — the realistic floor for actively managed paid media at any location.
*Compares the cost of paid media management at your current %-of-spend fee against Strategy Collective’s flat per-location model at $85/loc/mo avg. at your scale. Zero %-of-spend — your ad budget can scale without inflating fees.
How the math works: Your current agency charges a flat percentage of every dollar you spend — so the more you spend, the more they earn for the same work. Strategy Collective replaces that with a two-part flat-fee model for paid media management: a sliding per-location rate that decreases as your platform scales, plus a small spend-density component anchored to the actual media being managed. Your fees stay predictable; your incentive aligns with EBITDA, not ad budget. Across realistic platform sizes, this lands roughly 10–35% below the tiered market incumbent.
Not ready to talk yet?
Read our full executive briefing on the exact mathematics of transitioning from an OpEx percentage-of-spend agency to a CapEx infrastructure model.
The Execution
We bring the ‘adults in the room’ mentality to your media buying. Strategy Collective treats paid media as a precision financial instrument, backed by sound strategy, elite service, and absolute experts. We shift your capital away from low-margin ‘awareness’ campaigns and deploy EMR-integrated infrastructure that forces algorithms to optimize for actual clinical revenue.
-
14-Day Campaign Launch SLA from Signed SOWEMR-Integrated Attribution
By piping actual booked-appointment data back into Google, Meta, and StackAdapt via tools like Liine and CallRail, we force machine-learning algorithms to hunt for actual clinical revenue.
“We went from flying blind on ad spend to seeing exactly which campaigns drove booked appointments—within the first 30 days. Our cost-per-acquisition dropped 40%.”
— VP Marketing, PE-Backed Behavioral Health Platform -
Payer-Mix Optimization
Our targeting architecture explicitly filters out low-reimbursement traffic. We train the algorithms to seek out commercial insurance and cash-pay patients to maximize the margin yield per clinical hour.
-
Capacity-Aware Expansion Pods
We deploy hyper-localized Google Ads on a predictable, flat-fee per-location model. When your clinic hits capacity, we throttle the spend to protect your operational EBITDA.
Internal VPs of Marketing are tasked with impossible M&A roll-up schedules, lean teams, and boardrooms demanding instant ROI. But building an internal execution team takes 8 months and adds $1.2M+ in permanent payroll overhead. We act as your specialized execution layer—we consolidate vendor sprawl, execute the heavy digital lifting, and give you the closed-loop data required to prove your exact EBITDA contribution to the board.
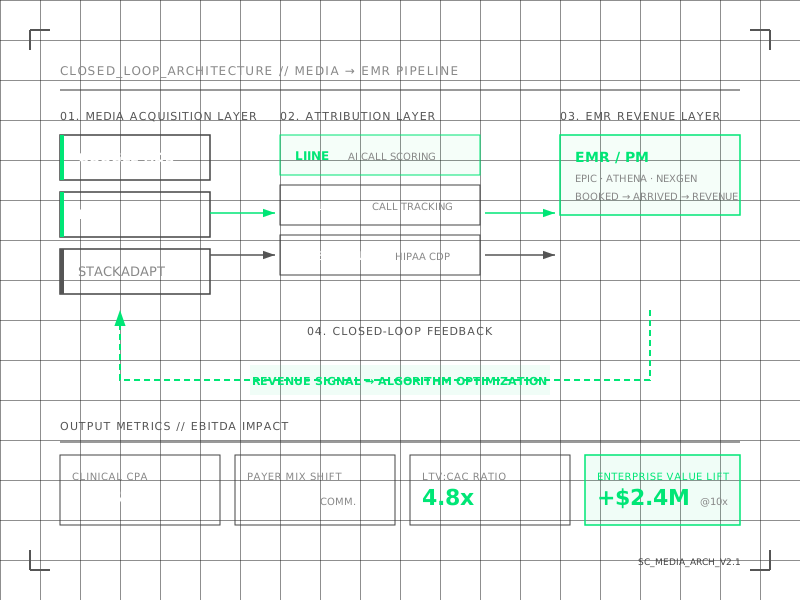
INTEGRATED
CLOSED LOOP
Clinical Yield, Not Just Clicks.
Impressions and CTR tell you how the campaign performed. These metrics tell you how the business performed — from first impression through completed surgical conversion.
Do you know your exact target acquisition cost?
The highest-performing platforms in your market do. With millions in managed ad spend across ABA, Dental, Vet, and MedSpa verticals, we can benchmark exactly what your patient acquisition cost should be—and whether there’s room to improve.
Get Your Industry Benchmarks
Download the 180-Day De Novo Launch Playbook.
See the exact timelines, budgets, and operational checklists we use to fill clinical waitlists and recruit elite providers before the doors even open.
Purpose-Built Infrastructure
Every tool in our stack is selected for a specific clinical and financial outcome. We operate a fully integrated media-to-EMR pipeline.